

The cost of not knowing: how uncertainty weighs on the euro area economy
Prepared by Malin Andersson, Alina Bobasu, Lorena Saiz and Stefania Scrofani
1 Introduction
Economic uncertainty has increasingly become a defining feature of the macroeconomic environment. The euro area economy has been repeatedly exposed to large and multifaceted shocks in recent years, which have been accompanied by a marked rise in uncertainty along with a discernible softening or even contraction of economic activity. Understanding the role and economic impact of uncertainty is particularly important in the current geopolitical environment.
The relationship between uncertainty and economic activity has been well established in both theory and empirical work. When the future becomes harder to predict, households tend to cut back on spending and build precautionary savings buffers, while firms delay or scale back investment and hiring decisions. Financial conditions often tighten, as investors demand higher compensation for the uncertainty of their investment, pushing up risk premia and making credit more expensive or less accessible. Uncertainty can increase suddenly and exogenously, as the direct result of a geopolitical event for example. Alternatively, it can rise in response to other shocks and amplify their direct effects on economic activity.
The article reviews recent developments in uncertainty indicators for the euro area and assesses implications of rising uncertainty for economic activity. Section 2 defines the concept of economic uncertainty and illustrates recent developments in available metrics. Section 3 discusses the transmission channels through which uncertainty propagates to consumption and investment and to the broader real economy. Section 4 presents empirical evidence on the ways uncertainty affects real economic activity, and Section 5 concludes.
2 Economic uncertainty: from concept to measurement
Economic uncertainty is the extent to which households, firms, investors and policymakers find it difficult to assess future economic outcomes. It arises when the range of possible future states of the economy is wide, when the likelihood of those states is hard to quantify, or when the underlying structure of the economy appears to be changing. In practical terms, uncertainty reflects a lack of clarity about variables such as future growth, inflation, interest rates, employment, profits, asset prices or policy decisions. Uncertainty can stem from a variety of sources. These include macroeconomic shocks, such as unexpected recessions, inflation surges or exchange rate swings; political and policy developments, including trade disputes or regulatory changes; geopolitical events, such as wars or terrorist attacks; financial market stress, including banking crises or sharp asset price corrections; technological and structural change, such as rapid innovation, digitalisation and automation; and natural disasters or health crises, including pandemics.
Uncertainty is distinct from both risk and confidence. In economic terms, uncertainty, in the sense of Knight (1921), arises in situations where the set of possible outcomes and their probabilities are unclear and difficult to assess. Risk, by contrast, arises when the distribution of outcomes is known or can be reasonably estimated. Uncertainty is also distinct from confidence. Confidence relates to expectations about the most likely outcome – i.e. it reflects where households and firms believe the economy is heading. Uncertainty, on the other hand, captures the width of the distribution of possible outcomes, or how much households and firms disagree about the range of possible future outcomes, independently of what the central expectation is.
Uncertainty can act as an exogenous source of macroeconomic fluctuations. When an event triggers an abrupt increase in uncertainty, the future suddenly becomes harder to assess. This can occur independently of any prior deterioration in economic conditions, such that the associated rise in uncertainty proxies cannot be fully attributed to other exogenous shocks. Heightened uncertainty surrounding trade policy in 2018 and 2025 provides clear examples of such uncertainty shocks, with trade policy uncertainty rising sharply as a result of changes in US tariffs that were announced unexpectedly, and subsequently escalated and renegotiated.
Uncertainty can also change in response to other shocks in the economy. In some cases, it may amplify the effects of other shocks, such as a collapse in demand or an oil supply disruption. The 2008-09 global financial crisis, for example, is an illustration of an endogenous rise in uncertainty. The financial shock was the initial trigger, with contractionary effects on the economy which were amplified by the heightened uncertainty surrounding the duration and depth of the crisis and its propagation.[1] However, uncertainty may also dampen the effects of other shocks, such as an accommodative monetary policy shock, by inducing caution among households and firms. This cautious behaviour might limit the economy’s responsiveness, attenuating the policy’s intended stimulative effects.
This article focuses primarily on uncertainty as an exogenous source of macroeconomic fluctuations, and hence as an exogenous shock. Such shocks are methodologically difficult to isolate and are therefore estimated using various different identification strategies and assumptions.
Economic uncertainty, being unobservable, is measured using a variety of proxies which differ in both methodology and scope.[2] There is no single objective metric, but uncertainty proxies can generally be grouped into four main categories.
Text-based metrics include the index of economic policy uncertainty (EPU) developed by Baker et al. (2016), as well as the indices of trade policy uncertainty (TPU) and geopolitical risk devised by Caldara et al. (2020) and Caldara and Iacoviello (2022). Such measures aim to capture uncertainty around policy and geopolitical developments through news outlets, earnings calls and other textual sources. Their accuracy and reliability can, however, be affected by changes in language over time and the inherent biases present in the news sources they rely on, as well as by imprecise word counts as measures of intensity. For instance, the TPU index tends to be highly volatile and may capture not only uncertainty shocks but also actual policy changes and shifts in media attention.[3]
Survey-based indicators reflect the perceptions of firms and households separately. The European Commission’s surveys, for example, ask business managers and consumers to indicate how difficult it is to make predictions about their business situation and household finances, in order to capture uncertainty. However, such monthly measures do not necessarily capture uncertainty around fast-evolving events in a timely manner.
Financial market-based indicators, such as implied stock market volatility measures, react quickly to new information, providing real-time, high-frequency signals of uncertainty among market participants. One common example is the VSTOXX index, which plots the implied volatility derived from EURO STOXX 50 option contracts with maturities from one month up to two years, enabling it to act a forward-looking, high-frequency measure of investor uncertainty across euro area blue-chip companies. Another example is the Composite Indicator of Systemic Stress (CISS), which aggregates 15 individual financial stress measures across five market segments, accounting for their time-varying cross-correlations.[4] Spikes in these indicators can, however, reflect shifts in risk aversion or investor sentiment rather than genuine macroeconomic uncertainty, which makes them harder to interpret.
Finally, model-based measures capture the degree of unpredictability in macroeconomic outcomes. The measure developed by Jurado et al. (2015), for example, defines uncertainty as the volatility of three-month ahead forecast errors for a wide range of economic indicators. Forecast disagreement is also a model-based measure commonly used as a proxy for economic uncertainty. For example, an increase in the dispersion of forecasts by panellists surveyed by Consensus Economics typically signals that it has become more difficult to assess the economic outlook. This type of measure captures differences in views among forecasters, however, rather than uncertainty around each individual forecast and should therefore be interpreted with caution.
While measures capturing longer-term policy uncertainty and geopolitical uncertainty have remained persistently elevated, those more closely tied to the short-term financial and economic situation have fallen from their pandemic peaks to more usual, relatively low levels.[5] Among the text-based measures, the EPU index has increased with numerous shocks (Chart 1). Since 2019 it has remained above historical norms and increased gradually. The European Commission’s survey-based measure of economic uncertainty increased sharply during the pandemic and again at the time of Russia’s invasion of Ukraine (Chart 1). The TPU index spiked around the tariff announcements in 2018 and again more recently in 2025 (Chart 2). Financial market-based indicators of uncertainty have tended to reach their peaks during episodes of elevated financial stress (Chart 3). Model-based measures of macroeconomic uncertainty, such as that of Jurado et al. (2015), and the measure capturing forecast disagreement point to the outbreak of the COVID-19 pandemic in Europe as the single largest uncertainty shock in recent times, surpassing even the global financial crisis (Chart 4). Outside of these two major events, both measures have remained more stable than text- and market-based proxies.
Chart 1
Economic policy uncertainty and survey-based uncertainty
(standardised index)
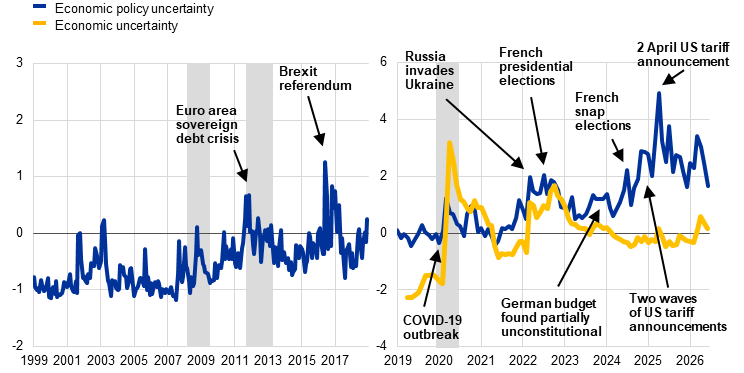
Sources: Baker et al. (2016) and ECB staff calculations.
Notes: Areas in grey denote euro area recessions as identified by the Centre for Economic Policy Research (CEPR). Data are from 2001 onwards for the four largest euro area countries, weighted in accordance with their respective GDP in 2025. Before 2001 the series is based on the three largest euro area countries (Germany, France and Italy), as data for Spain are not available. Both series are standardised over their respective samples. The European Commission uncertainty series starts in April 2019. It is a weighted average of the sectoral series for industry (40%), services (30%), consumers (20%), construction (5%) and retail trade (5%), expressed as percentage point balances The series has been standardised over its respective sample. Only uncertainty shocks featuring in the main estimations – see Chart 5 – have been labelled. The latest observations are for June 2026.
Chart 2
Trade policy uncertainty
(standardised index)
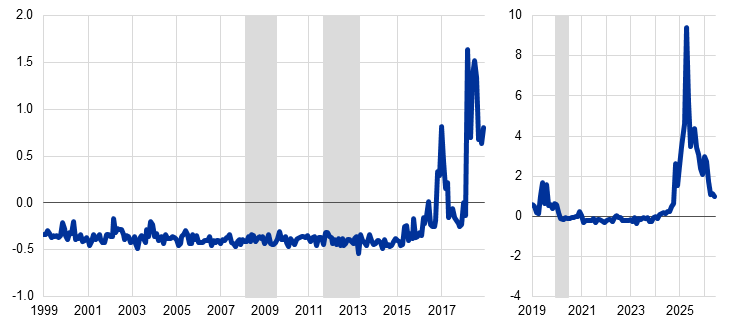
Sources: Caldara et al. (2020) and ECB staff calculations.
Notes: Areas in grey refer to euro area recessions as identified by CEPR. The chart shows the TPU index of Caldara et al. (2020) for the United States. It is split into two panels to capture the higher overall level of the indicator in the most recent period. The latest observations are for June 2026.
Chart 3
Financial market-based measures of economic uncertainty
(left-hand scale: normalised scale; right-hand scale: index)
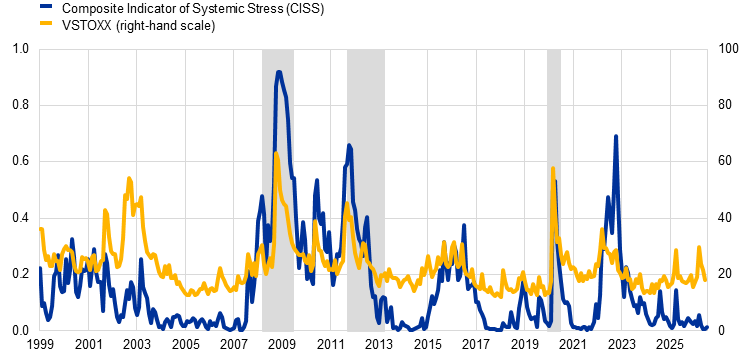
Sources: Haver Analytics and ECB.
Notes: Areas in grey denote euro area recessions as identified by CEPR. The CISS is measured as a normalised scale between 0 and 1. The VSTOXX index shows the implied volatility derived from eight VSTOXX subindices, reflecting respectively the actual next 1, 2, 3, 6, 9, 12, 18 and 24-month expiries of EURO STOXX 50 option contracts on the Eurex Exchange. The latest observations are for June 2026 for the CISS and July 2026 for the VSTOXX.
Chart 4
Model-based and statistical measures of economic uncertainty
(standardised indices)
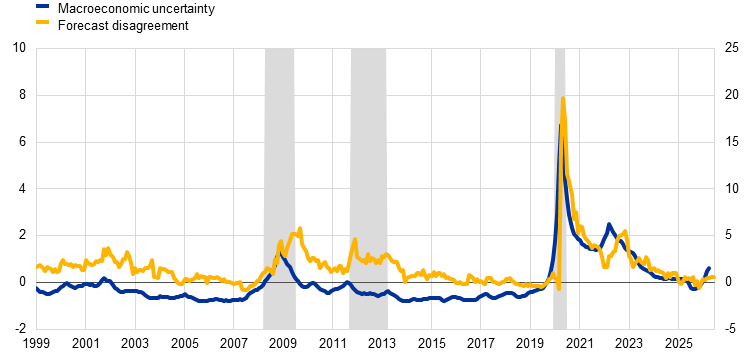
Sources: Jurado et al. (2015) and ECB staff calculations.
Notes: Areas in grey denote euro area recessions as identified by CEPR. The series are standardised over their respective samples. The measure of macroeconomic uncertainty is taken from Jurado et al. (2015), who define uncertainty as the volatility of three-month ahead forecast errors for a wide range of economic indicators. Forecast disagreement in the euro area is measured as the unweighted average of the standard deviations of next-year forecasts provided by Consensus Economics panel members for growth in real GDP, private consumption, fixed investment, consumer prices, industrial production and long-term interest rates. The latest observations are for April 2026 for the measure of macroeconomic uncertainty and June 2026 for forecast disagreement.
3 Channels of transmission from uncertainty to real activity
The academic literature has identified a set of transmission channels through which uncertainty shocks depress real economic activity, the first being the “real options” channel. The theoretical foundations of this channel rest on the irreversibility of most capital expenditure and the option value of waiting. Bernanke (1983) shows that when investment decisions are irreversible, firms facing heightened uncertainty are incentivised to delay action, i.e. to “wait and see” until greater clarity emerges, leading to a cyclical downturn in capital spending. Bloom (2009) demonstrates that higher uncertainty causes firms to temporarily pause their investment and hiring, producing the characteristic V-shaped pattern in output and employment. However, the real options channel does not operate exclusively as a drag on investment. For intangible-intensive firms, early-stage investments in research and development (R&D) or organisational capital unlock future competitive opportunities that would otherwise be permanently foreclosed. This is due to the compounding and path-dependent nature of intangible capital accumulation, thereby incentivising firms to maintain such expenditures and hoard labour during downturns (Dixit and Pindyck, 1994).
A second well-established channel involves precautionary saving. Heightened uncertainty leads households to reduce consumption and accumulate savings, resulting in postponed and persistently weak demand (Coibion et al., 2024). This effect is likely to be particularly pronounced for purchases of major durable goods such as housing and cars, where expenditure is large and difficult to reverse.
The third channel, which amplifies the initial real options effect, is the financial frictions channel. Caldara et al. (2016) show that, through the financial frictions channel, uncertainty shocks are strongly associated with a widening of credit spreads and a reduction in the risk-bearing capacity of lenders such as banks. This raises the premium on external finance, pushes up borrowing costs and compounds the direct “wait and see” effect on investment through a tighter credit supply. Alfaro et al. (2024) coined the term “finance uncertainty multiplier” to describe the role played by financial frictions in magnifying the real effects of uncertainty shocks.
Finally, households and firms may adapt their behaviour over time, particularly when uncertainty remains high for a long period. If uncertainty becomes a “new normal”, households and firms may adjust their expectations and decision-making frameworks accordingly. Firms, for instance, might adopt greater flexibility in their operations, implementing more agile production processes or diversifying supply chains to reduce exposure to a volatile environment (Namdar et al., 2025). Firms facing persistent uncertainty may also invest in technologies that improve efficiency and competitiveness (Bloom, 2009; Dixit and Pindyck, 1994).[6] Households may optimise their savings and consumption patterns to better navigate uncertain environments by holding larger precautionary savings buffers to smooth consumption over time.
4 Empirical evidence on the effects of uncertainty on real economic activity for the euro area
This section uses a Bayesian structural vector auto-regressive (SVAR) model including narrative and sign restrictions to identify the impact of economic policy uncertainty on the economy. Identifying the independent contribution of uncertainty is a key methodological challenge and requires additional assumptions about what drives uncertainty indicators on specific dates. Narrative and sign restrictions help identify exogenous changes in uncertainty. Narrative restrictions, based on the approach proposed by Antolín-Díaz and Rubio-Ramírez (2018), require the identified uncertainty shock to explain most of the dynamics of economic policy uncertainty in the specified episodes. To address the concern that the narrative method may not fully resolve the endogeneity between uncertainty and other economic variables, this section also reviews the findings of a complementary proxy SVAR approach to identification.
Among the broad range of uncertainty measures available, the empirical analysis focuses mainly on the EPU index. Unlike with financial volatility measures such as the VSTOXX index, peaks in the EPU are predominantly driven by political and institutional developments, whose timing may be exogenous to the business cycle.[7] The EPU index is also one of the most encompassing indicators, aggregating news signals across multiple policy domains such as fiscal and trade policies, thus making it particularly suited to measuring uncertainty in the recent period. At the same time, it remains very much relevant at the current juncture given it has remained elevated over recent years.
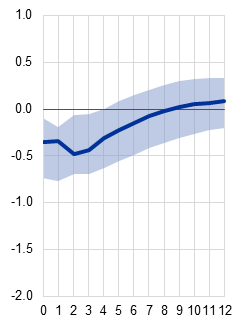
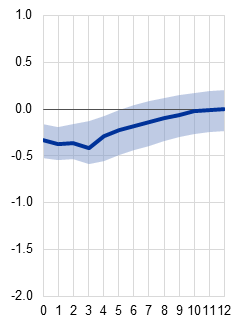
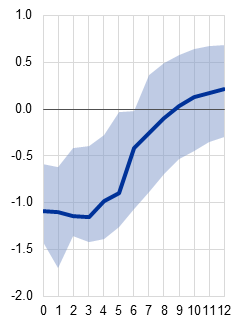
Results from the empirical model show that increases in uncertainty have a negative impact on euro area economic activity. The narrative restrictions define several episodes in which a sharp rise in economic policy uncertainty in the euro area was clearly due to exogenous sources (Chart 1).[8] The EPU index increases at each of these dates, providing robust and internally consistent anchors for the identification. The findings of the narrative SVAR model reveal that the adverse impact on real GDP growth of these episodes is primarily driven by lower business investment and, to a lesser extent, by private consumption (Chart 5).[9] The strongest effects are registered for both domestic demand components after about three quarters. Private consumption declines by 0.4% at the trough and starts to gradually recover thereafter. Business investment, by contrast, falls by 1.2% and remains subdued for somewhat longer following the shock.
Chart 5
Impact of a rise in economic policy uncertainty: model-based estimates in the narrative SVAR framework
a) Real gross domestic product |
b) Real private consumption |
c) Real business investment |
|---|---|---|
(percentage deviations; quarters) |
(percentage deviations; quarters) |
(percentage deviations; quarters) |
 |
 |
 |
Source: ECB staff calculations.
Notes: Impulse responses to a one standard deviation economic policy uncertainty shock identified via narrative sign restrictions in a Bayesian SVAR estimated on euro area quarterly data over the period from the first quarter of 2001 to the first quarter of 2026. The model includes seven variables – the EPU index, real GDP growth, private consumption growth, investment growth, HICP inflation, equity returns and the average of short and long-term interest rates – with four lags and a Minnesota prior. Identification is via narrative sign restrictions following Antolín-Díaz and Rubio-Ramírez (2018). These restrictions require that the uncertainty shock explain most of the dynamics of the EPU index in the specified episodes: the euro area sovereign debt crisis, the Brexit referendum, the outbreak of the COVID-19 pandemic, Russia’s invasion of Ukraine, the French presidential elections in 2022, the German Constitutional Court’s ruling in November 2023 that the budget was partially unconstitutional, the snap French elections in June and July 2024, and three successive waves of US trade policy escalation at end-2024 and in 2025. The model additionally identifies a demand and supply-side shock. Shaded areas denote 68% confidence bands.
The model estimation also suggests that economic policy uncertainty shocks weighed significantly on euro area activity in 2025. The narrative framework suggests that uncertainty shocks subtracted around 0.4 percentage points from real GDP growth in the period from the first quarter of 2025 to the first quarter of 2026, with the impact coming mainly through business investment and, to a lesser extent, via the private consumption channel. Given the persistent effects of uncertainty shocks and the currently elevated levels of economic policy uncertainty as a result of the war in the Middle East, uncertainty is likely to continue exerting a drag on real economic activity throughout 2026.
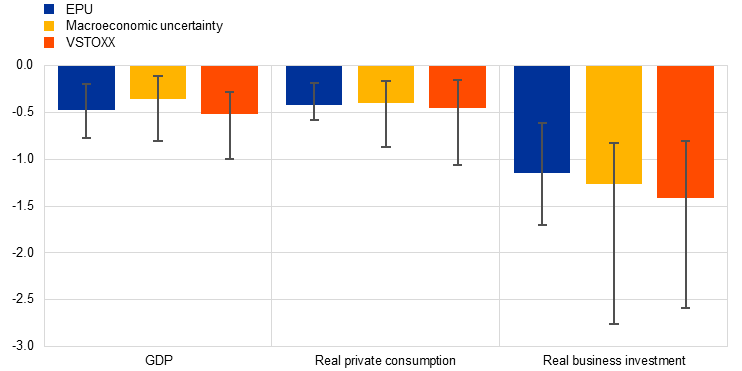
Using a similar framework with alternative measures of uncertainty, the estimated macroeconomic impact is confirmed. As a robustness analysis, a measure based on narrative restrictions for the VSTOXX index and the measure developed by Jurado et al. (2015) is calibrated on the largest quarter-on-quarter spikes recorded by each measure over the sample period. These spikes differ from those used in the EPU baseline and therefore reflect the distinct dimensions of uncertainty each measure captures.[10] Notwithstanding these differences in identification, the impulse responses across the three measures consistently show that uncertainty shocks exert a significant drag on euro area real GDP growth, primarily through business investment and, to a lesser extent, through private consumption (Chart 6).
Chart 6
Impact of a rise in alternative uncertainty measures
(percentage deviations at trough)
Sources: Baker et al. (2016), Haver Analytics, Jurado et al. (2015) and ECB staff calculations.
Notes: Impulse responses normalised to a one standard deviation uncertainty shock identified via narrative sign restrictions in a Bayesian SVAR model estimated on euro area quarterly data over the period from the first quarter of 2001 to the first quarter of 2026. The model includes one uncertainty measure at a time (see notes to Chart 5 for more details) and follows the same approach as described in the text for the EPU index. The chart shows the 68% confidence bands. The measure of macroeconomic uncertainty is taken from Jurado et al. (2015).
A proxy SVAR identification provides a complementary and robust cross-validation of the narrative approach. Following Mertens and Ravn (2013) and Stock and Watson (2018), a proxy SVAR is estimated to address concerns of potential simultaneity between uncertainty and economic variables by exploiting exogenous gold price reactions as an instrument for uncertainty shocks.[11] An instrumental proxy is constructed, with the rationale that unexpected uncertainty drives investors into gold, independently of simultaneous demand, supply and monetary policy disturbances.[12] The constructed proxy covers 21 observations over 2000-25, spanning shocks stemming from the global financial crisis, the euro area sovereign debt crisis, the Brexit referendum and the 2 April 2025 US tariff announcement.[13]
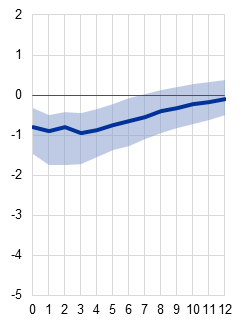
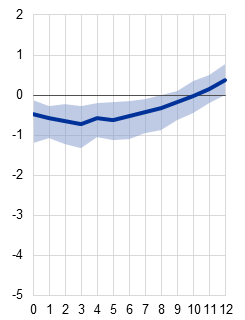
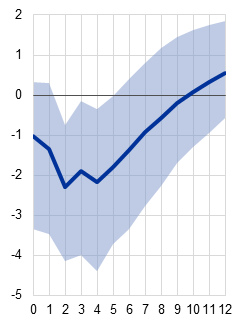
The findings from the proxy SVAR framework confirm that economic policy uncertainty shocks weigh materially on euro area activity, with investment displaying the sharpest and most persistent contraction (Chart 7). A one standard deviation EPU index shock causes real GDP to fall by around 1% at the trough before recovering gradually over seven quarters. Private consumption declines by approximately 0.7% at its trough, reflecting household caution in the face of heightened uncertainty. Business investment contracts considerably more strongly, by roughly 2%, and while there is a rebound after six quarters, this recovery is not statistically significant. This pattern is consistent with the real options mechanism, whereby firms facing irreversible capital commitments prefer to delay expenditure until uncertainty resolves. This means that business investment shows a more pronounced and overall more protracted response to a shock than more reversible or flexible spending categories. These findings broadly corroborate the narrative sign restrictions model, confirming that the estimated effects are not an artefact of the identifying assumptions. While magnitudes are somewhat greater under the proxy approach, the direction and relative ordering of responses across expenditure components are consistent across the two identification strategies.
Chart 7
Model-based estimates of the effects of economic policy uncertainty in the proxy SVAR framework
a) Real gross domestic product |
b) Real private consumption |
c) Real business investment |
|---|---|---|
(percentage deviations; quarters) |
(percentage deviations; quarters) |
(percentage deviations; quarters) |
 |
 |
 |
Sources: Baker et al. (2016), Eurostat, ECB and Eurosystem Macroeconomic Projection Database and ECB staff calculations.
Notes: Impulse responses to a one standard deviation economic policy uncertainty shock. The model includes seven variables: the EPU index, real GDP growth, private consumption growth, investment growth, HICP inflation, equity returns and the average of short and long-term interest rates. It is estimated for the period covering the first quarter of 1999 to the first quarter 2026 using four lags. Shaded areas show 68% confidence bands. Dummy variables for the first and second quarters of 2020 are included as exogenous regressors to absorb the pandemic-related outliers without attributing them to the economic policy uncertainty shock. The EPU index is instrumented with a proxy constructed from the variations in the price of gold around specific uncertainty events relevant for the euro area. The proxy is constructed using a database of 170 geopolitical and economic events over 2000-25, retaining only quarters in which the EPU index rose significantly (i.e. the quarterly change exceeded its mean plus half a standard deviation) and where the associated daily gold price reaction was positive, ensuring that only exogenous uncertainty increases are captured. Event-level gold price log returns are summed within qualifying quarters to yield the final quarterly proxy series. Only positive gold reactions are retained, as negative reactions on uncertainty event days are ambiguous, potentially reflecting dollar appreciation, profit-taking or policy relief rather than a genuine uncertainty impulse.
A more granular assessment of consumption and investment components points to differing reactions to uncertainty. A decomposition of business investment into tangible and intangible assets reveals different reactions to uncertainty. Investment in intangibles, including AI-related technologies, has shown greater resilience than investment in tangible assets during recent episodes of high uncertainty (see Box 1). As for private consumption, uncertainty dampens household spending on both goods and services, but the initial effect is particularly large for durable goods, such as cars. At the same time, consumption of durable goods resumes swiftly after an uncertainty shock, while spending on services remains subdued for longer (see Box 2).
Box 1
Does uncertainty affect business investment in tangible and intangible assets differently?
Prepared by Lorena Saiz and Stefania Scrofani
As shown in Section 4 of the article, business investment is the most sensitive component of aggregate demand to uncertainty. With the increasing shift in the composition of business investment towards intangibles in recent years, this box investigates whether uncertainty has a different impact on tangible and intangible investments, using both aggregate macroeconomic data and firm-level micro data.
A well-established channel through which uncertainty affects business investment is irreversibility, the degree of which determines the sensitivity of investments to uncertainty.[14] Tangible investments, in machinery, equipment, infrastructure and so on, often involve significant upfront costs and long payback periods, making them highly sensitive to uncertainty. Intangible investments, such in research and development (R&D), software, intellectual property, organisational capital and the like, are often more firm-specific and harder to collateralise, and involve quasi-fixed costs that are difficult to recover. These characteristics suggest that intangible investment may also be very sensitive to uncertainty.
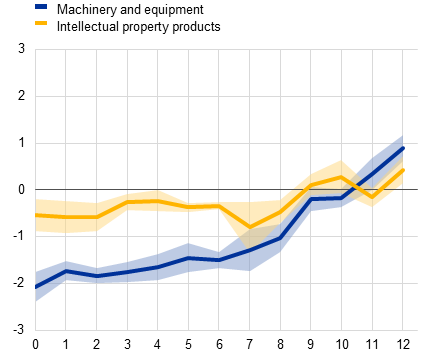
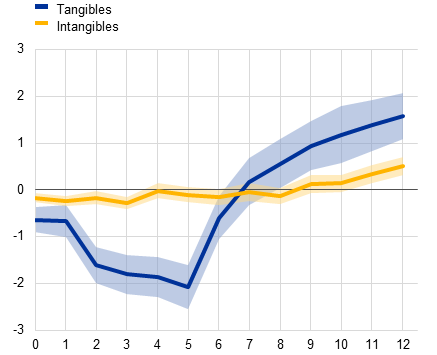
However, empirical evidence suggests that intangible investments are generally less sensitive to short-term uncertainty than tangible investments. At the macro level, uncertainty shocks depress tangible investment − proxied by capital expenditure on machinery and equipment − while the response of intangible investment − proxied by spending on intellectual property products − is much smaller (Chart A, panel a). A similar pattern can be observed using firm-level data. Capital expenditure on tangible assets falls substantially more than intangible investment, even after controlling for the usual determinants of investment such as financial performance, leverage, liquidity and firm size (Chart A, panel b).
Two mechanisms help explain this apparent paradox. First, intangible investments are typically long-term, aimed at improving efficiency, reducing costs or building competitive advantages that generate returns across a range of possible future scenarios (Zhang, 2026). Moreover, firm-specific intangible assets entail stronger adjustment frictions: interrupting R&D can destroy accumulated knowledge, while labour-intensive organisational capital encourages labour hoarding during downturns (Crouzet and Eberly, 2026).[15] The second mechanism, reinforcing this asymmetry, is the financing channel, as intangible investment relies more on internal funds and equity, insulating it from a tightening of credit conditions (Gareis and Mayer, 2023). Summing up, uncertainty seems to affect tangible and intangible investments differently as a result of their distinct characteristics and financing channels.
Chart A
Impact of uncertainty shocks on tangible and intangible investments, by type of data
a) Macroeconomic aggregates |
b) Firm-level data |
|---|---|
(percentage deviations; quarters) |
(percentage deviations; quarters) |
 |
 |
Sources: Eurostat, LSEG and ECB staff calculations.
Notes: The charts show impulse responses to an uncertainty shock of one standard deviation. The uncertainty shock used is that identified using narrative sign restrictions in the main text. The results in panel a) are based on a local projections model for a panel of the five largest euro area countries (Germany, Spain, France, Italy and the Netherlands). The results in panel b) are based on a local projections model for a sample of euro area non-financial firms from the Worldscope database for which quarterly R&D expenses data are available. In panel b), intangible investment is proxied by R&D expenditure (knowledge capital) and 30% of selling, general and administrative expenses (SGA) (organisational capital). Both tangible and intangible investment are measured relative to the firms’ total assets augmented with capitalised R&D and SGA as in Zhang (2026). The variables of both panel a) and panel b) are log-transformed. Shaded areas denote the 68% confidence bands.
Box 2
Does uncertainty affect household spending on goods and services differently?
Prepared by Alina Bobasu
Uncertainty weighs on household spending, but its effects are not uniform. This box analyses how rising uncertainty influences consumption decisions, focusing on differences across categories (based on the COICOP classification system) along the dimension of durability.
The sensitivity of a given consumption category to uncertainty shocks depends primarily on the degree to which purchases can be postponed and on the associated adjustment costs. Durable goods are by nature storable and long-lived, meaning that the timing of their acquisition is highly flexible. Individuals can delay decisions on buying durables such as housing, cars and furniture, and the option value of waiting rises substantially when income uncertainty is greater. Spending on non-durable goods and services such as food and health care is structurally harder to postpone, so the real options effect of uncertainty is weaker for these categories. Accordingly, the empirical literature consistently finds a gradient in the sensitivity of consumption to uncertainty shocks, running from durables, which are the most sensitive, to essential services, which are the least sensitive. This pattern reflects the interplay between “postponability” and adjustment costs across spending categories.
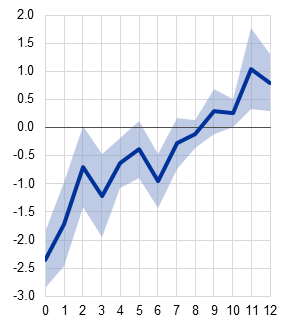
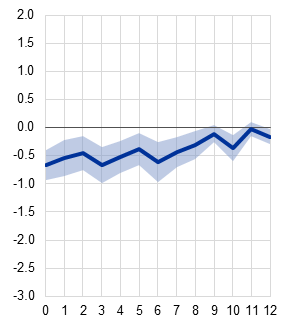
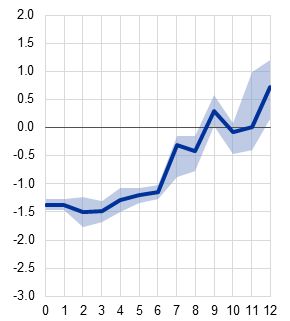
According to the findings of a panel local projections model, uncertainty shocks exert a negative and statistically significant effect on all three components of private consumption, with the magnitude and persistence of the response varying with the degree of durability and “postponability” of the category (Chart A).[16] Consumption of durable goods declines most following an uncertainty shock, which is consistent with the real options mechanism described above. The peak negative response of durables exceeds that of non-durables and services, but the effects are more short-lived.
Chart A
Impact of economic policy uncertainty shocks on private consumption components
(percentage deviations; quarters)
a) Durable goods |
b) Non-durable goods |
c) Services |
|---|---|---|
 |
 |
 |
Sources: Eurostat and ECB staff calculations.
Notes: The chart shows the results of a panel local projections model for the five largest euro area countries (Germany, Spain, France, Italy and the Netherlands) with an (unbalanced) sample, running from the first quarter of 1999 to the first quarter of 2026 and accounting for country fixed effects. The model includes the components of real private consumption (durable goods, non-durable goods and services) as dependent variables. Real GDP, the average of short-term and long-term rates and inflation have been added to the model as control variables. The uncertainty shocks are those estimated via the narrative sign restrictions approach. The local projections are estimated using four lags for the control variables and for each successive dependent variable. Shaded areas denote 68% confidence bands, reflecting sampling uncertainty around the estimated regression coefficients. The impulse response functions are not directly comparable with the aggregate euro area consumption responses reported in the main text, which are estimated from a different model and using data for the whole euro area.
Consumption of non-durable goods also responds negatively to uncertainty shocks, albeit by less than durable goods. The response is nonetheless persistent, with the level of non-durable consumption remaining below the baseline for several quarters before gradually recovering from the initial shock. Consumption of services displays an interesting dynamic. The decline on impact is relatively pronounced and persistent, followed by a slow and relatively protracted recovery in line with the observed dynamics for total private consumption described in the main text.
Overall, the faster recovery of durable goods spending relative to non-durables and services likely reflects two reinforcing mechanisms. First, postponement of durable purchases generates pent-up demand that is released rapidly once uncertainty recedes – a stock-adjustment dynamic formalised by Caballero (1991) and consistent with the “wait and see” evidence in Bloom (2009). Second, durable expenditure is frequently financed through consumer credit, and the easing of financial conditions that often accompanies the unwinding of an uncertainty shock provides additional impetus for a swift resumption of spending (Ludvigson, 1999). By contrast, foregone expenditures on services – and especially on leisure activities – are usually not recouped once the opportunity has passed, so the recovery in services is slow and spread over many quarters (Carroll, 1997). A complementary dimension of heterogeneity runs along the necessity versus discretionary distinction, with households cutting spending across both durable goods and services (Andreolli et al., 2025a, 2025b). Under uncertainty, households prioritise essential spending − food, utilities, health care − while sharply curtailing discretionary items such as hospitality, recreation and cultural services.[17]
5 Concluding remarks
Elevated uncertainty has significant and persistent adverse effects on euro area economic activity and amplifies business cycle fluctuations. Uncertainty shocks are found to weigh heavily on business investment, which contracts sharply on impact and remains depressed for several quarters. This is consistent with the real options mechanism, whereby firms postpone irreversible capital expenditure decisions when faced with heightened uncertainty about future demand and policy conditions. Private consumption responds more moderately, though the response is not negligible – particularly for spending on durable goods, which displays a sharper initial contraction but a faster recovery than non-durable spending. This reflects the greater willingness of consumers to delay and subsequently make large discretionary purchases once uncertainty recedes.
In the current environment, uncertainty remains an important factor shaping the economic outlook in the euro area. With text-based measures of geopolitical and trade policy uncertainty at high levels – reflecting geopolitical conflicts and trade tensions among other things – and given the lingering impact of uncertainty shocks, there are reasons to expect that uncertainty will continue to weigh on activity for the rest of the year. A key finding of this analysis is that uncertainty shocks do not affect all types of investment equally: investment in intangible assets seems less sensitive to such shocks. To the extent that the ongoing shift in the composition of investment towards intangibles continues, the aggregate response of investment to uncertainty shocks may become more muted over time. Such a compositional shift could therefore act as a gradual stabiliser of the investment cycle, even as uncertainty itself remains a significant driver of macroeconomic fluctuations. In any case, the expansion of the ECB’s analytical toolkit – including model-based scenario analysis and nowcasting tools – has increased the capacity of the Eurosystem to monitor and assess the impact of uncertainty on real economic activity in real time.
References
Alfaro, I., Bloom, N. and Lin, X. (2024), “The Finance Uncertainty Multiplier”, Journal of Political Economy, Vol. 132, No 2, February, pp. 577-615.
Andersson, M., Bobasu, A. and De Santis, R.A. (2024), “What are the economic signals from uncertainty measures?”, Economic Bulletin, Issue 8, ECB.
Andreolli, M., Rickard, N. and Surico, P. (2025a), “Non-Essential Business Cycles”, CEPR Discussion Paper, No 19773.
Andreolli, M., Rickard, N., Surico, P. and Vergeat, C. (2025b), “Discretionary spending is the cycle, and why it matters for monetary policy”, ECB Forum on Central Banking.
Antolín-Díaz, J. and Rubio-Ramírez, J.F. (2018), “Narrative Sign Restrictions for SVARs”, American Economic Review, Vol. 108, No 10, October, pp. 2802-2829.
Azqueta-Gavaldón, A., Diakonova, M., Ghirelli, C. and Pérez, J.J. (2026), “Diverging signals from economic uncertainty measures: uncovering coherence through news narratives”, Working Papers, No 2614, Banco de España.
Baker, S.R., Bloom, N. and Davis, S.J. (2016), “Measuring Economic Policy Uncertainty”, The Quarterly Journal of Economics, Vol. 131, No 4, November, pp. 1593-1636.
Bernanke, B.S. (1983), “Irreversibility, Uncertainty, and Cyclical Investment”, The Quarterly Journal of Economics, Vol. 98, No 1, February, pp. 85-106.
Bloom, N. (2009), “The Impact of Uncertainty Shocks”, Econometrica, Vol. 77, No 3, May, pp. 623-685.
Bloom, N. (2014), “Fluctuations in Uncertainty”, Journal of Economic Perspectives, Vol. 28, No 2, Spring, pp. 153-176.
Bobasu, A. and Pierluigi, B. (2026), “How is trade policy uncertainty affecting euro area activity?”, Economic Bulletin, Issue 2, ECB.
Bobasu, A., Quaglietti, L. and Ricci, M. (2024), “Tracking Global Economic Uncertainty: Implications for the Euro Area”, IMF Economic Review, Vol. 72, Issue 2, June, pp. 820-857.
Caballero, R.J. (1991), “Durable Goods: an Explanation for their Slow Adjustment”, NBER Working Paper, No 3748, June.
Caldara, D., Fuentes-Albero, C., Gilchrist, S. and Zakrajšek, E. (2016), “The macroeconomic impact of financial and uncertainty shocks”, European Economic Review, Vol. 88, Issue C, pp. 185-207.
Caldara, D., Iacoviello, M., Molligo, P., Prestipino, A. and Raffo, A. (2020), “The economic effects of trade policy uncertainty”, Journal of Monetary Economics, Vol. 109, pp. 38-59.
Caldara, D. and Iacoviello, M. (2022), “Measuring Geopolitical Risk”, American Economic Review, Vol. 112, No 4, April, pp. 1194-1225.
Carroll, C.D. (1997), “Buffer-Stock Saving and the Life Cycle/Permanent Income Hypothesis”, The Quarterly Journal of Economics, President and Fellows of Harvard College, Vol. 112, No 1, pp. 1-55.
Coibion, O., Georgarakos, D., Gorodnichenko, Y., Kenny, G. and Weber, M. (2024), “The Effect of Macroeconomic Uncertainty on Household Spending”, American Economic Review, Vol. 114, No 3, pp. 645-77.
Crouzet, N. and Eberly, J.C. (2026), “R&D Uncertainty and Cycles”, NBER Working Paper, No 34838, February.
Dibiasi, A., Mikosch, H. and Sarferaz, S. (2025), “Uncertainty Shocks, Adjustment Costs, and Firm Beliefs: Evidence from a Representative Survey”, American Economic Journal: Macroeconomics, Vol. 17, No 3, July, pp. 36-73.
Dixit, A. and Pindyck, R. (1994), “Investment under Uncertainty”, Princeton University Press.
Gareis, J. and Mayer, E. (2023), “Financial shocks and the relative dynamics of tangible and intangible investment: Evidence from the euro area”, Macroeconomic Dynamics, Vol. 27, No 5, pp. 1455-1480.
Holló, D., Kremer, M. and Lo Duca, M. (2012), “CISS – a composite indicator of systemic stress in the financial system”, Working Paper Series, No 1426, ECB.
Jordà, Ò, (2005), “Estimation and Inference of Impulse Responses by Local Projections”, American Economic Review, Vol. 95, No 1, pp. 161-182.
Jurado, K., Ludvigson, S.C. and Ng, S. (2015), “Measuring Uncertainty”, American Economic Review, Vol. 105, No 3, March, pp. 1177-1216.
Knight, F.H. (1921), “Risk, uncertainty and profit”, Houghton Mifflin Company, Boston and New York.
Ludvigson, S. (1999), “Consumption and Credit: A Model of Time-Varying Liquidity Constraints”, The Review of Economics and Statistics, Vol. 81, No 3, August, pp. 434-447.
Mertens, K. and Ravn, M.O. (2013), “The Dynamic Effects of Personal and Corporate Income Tax Changes in the United States”, American Economic Review, Vol. 103, No 4, pp. 1212-1247.
Namdar, J., Modi, S. and Blackhurst, J. (2025), “Diversify or Concentrate? Supply Chain Responses to Policy Uncertainty”, Journal of Supply Chain Management, Institute for Supply Management, Vol. 61, Issue 1, January, pp. 62-82.
Piffer, M. and Podstawski, M. (2018), “Identifying Uncertainty Shocks Using the Price of Gold”, The Economic Journal, Vol. 128, No 616, pp. 3266-3284.
Staiger, D. and Stock, J.H. (1997), “Instrumental Variables Regression with Weak Instruments”, NBER Working Paper, No t0151.
Stock, J.H. and Watson, M.W. (2018), “Identification and Estimation of Dynamic Causal Effects in Macroeconomics Using External Instruments”, The Economic Journal, Vol. 128, No 610, pp. 917-948.
Zhang, S. (2026), “Uncertainty shocks in an intangible economy”, Journal of Economic Dynamics and Control, Vol. 182, Issue C, 105230.
Legal Disclaimer:
EIN Presswire provides this news content "as is" without warranty of any kind. We do not accept any responsibility or liability for the accuracy, content, images, videos, licenses, completeness, legality, or reliability of the information contained in this article. If you have any complaints or copyright issues related to this article, kindly contact the author above.
